�������ɞ�Խ��Խ���صĹ����������}��ȫ�������߿����ѳ��^5�|��I�ͺ��ذYII���������ί��x���_�ȍu�أ����ʿ����ȍu�����oˎ���������ߵ��ί����P��Ҫ�������^����������ί�Ч�����^�ߌ����µ�Ѫ��������Σ������������������ҹ�g��Ѫ������������sռ���������˔���6%��Ŀǰ��Ҫ���÷ִ�ע���ȍu�ص���������ҹ�g��Ѫ�dž��}������ԓ������Ҫ�˹��{��ע����ȍu�����������^���韩����ˣ��OӋ����������푑��������ȍu���f���wϵ������Ѫ�ǝ�Ȍ��r���m���ؿ����ȍu�ص�ጷ���ҹ�gѪ�ǿ��ƾ�����Ҫ���x��
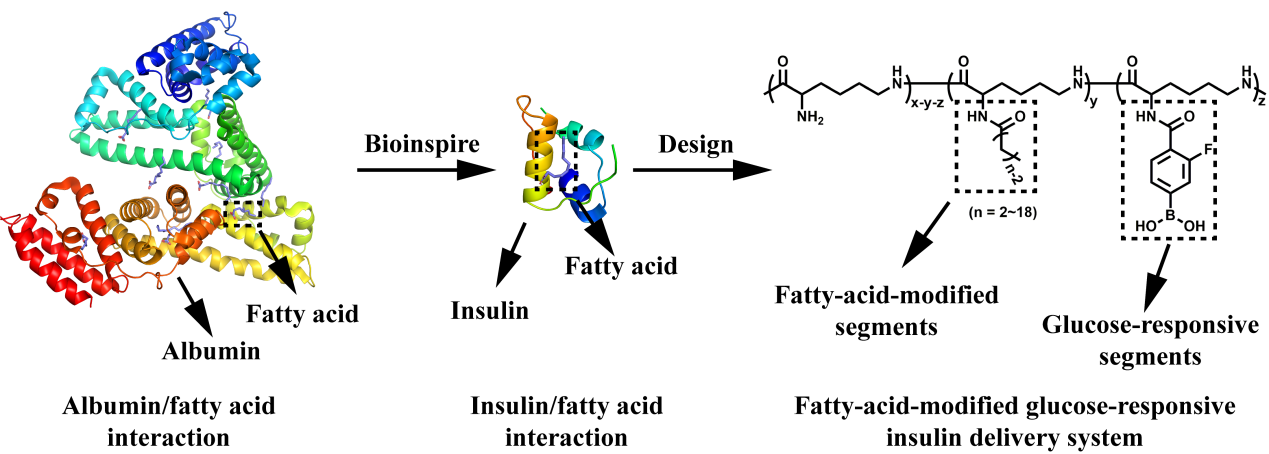
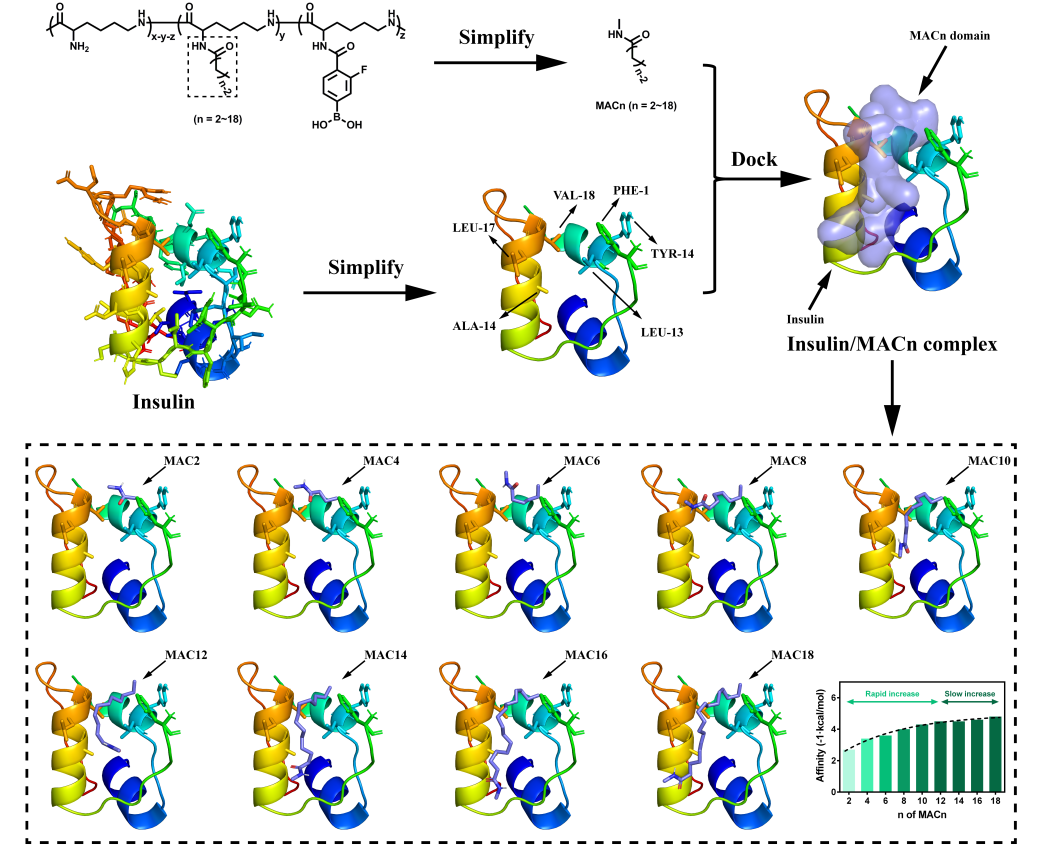
���գ��㽭��W�������ں�����ܸ����ڈF���֬����/������ˮ����õĆ��l�����ڷ��ӌ��Ӽ��g�OӋ��һ�N֬�����c�������������p��ļ{�����������ȍu��ؓ�d�cѪ�ǝ��푑�ጷţ����OӋ˼·��Figure 1��ʾ��ͨ�^���ӌ��Ӽ��g��֬������FƬ���c�ȍu�ص���������ҕ�������Y�ϔ��������l�F�S֬������F��L���L�����c�ȍu���g����ˮ����׃����Figure 2�����@�����������ȍu�ص�ͻ��О飬�Ķ������ȍu��ጷ��^�쌧�µĵ�Ѫ�ǰY�
ͨ�^�����C�������ᡢ�����ᡢ�����ᡢ��������¹��ጦ�{�������ԽM�b�О��Ӱ푣��l�F֬������F��L�m�Еr���{�������ԽM�b��ò��Ҏ�����������ȍu�ص�ؓ�d��Figure 3�����Ƃ���9�N֬�����c�������������p��{�����Ӳ��Y�x��������ļ{������C10MS�����ȍu��ؓ�d����0.17 g�ȍu��/g�d�w��C10MS�������ȍu�ص�ͻ��О飬���F�������������ȍu��ጷ����ܡ�

Figure 3. SEM images of (a) C4MS, (b) C6MS, (c) C8MS, (d) C10MS and (e) C12MS and the schematic diagrams (bar = 500 nm).
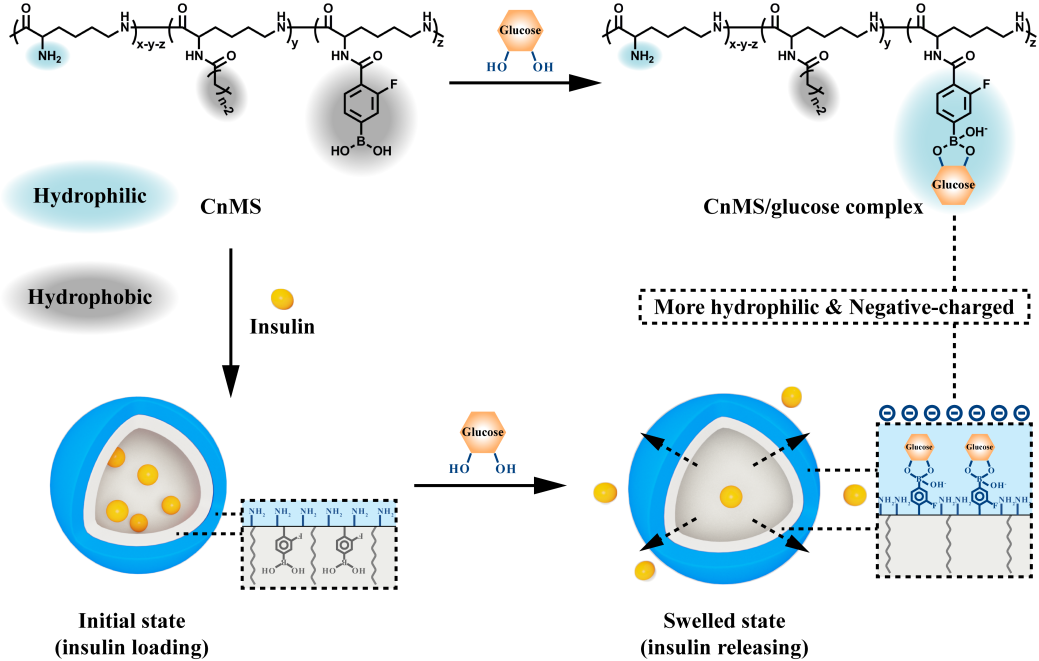
Figure 4. The glucose-responsive insulin-releasing mechanism.
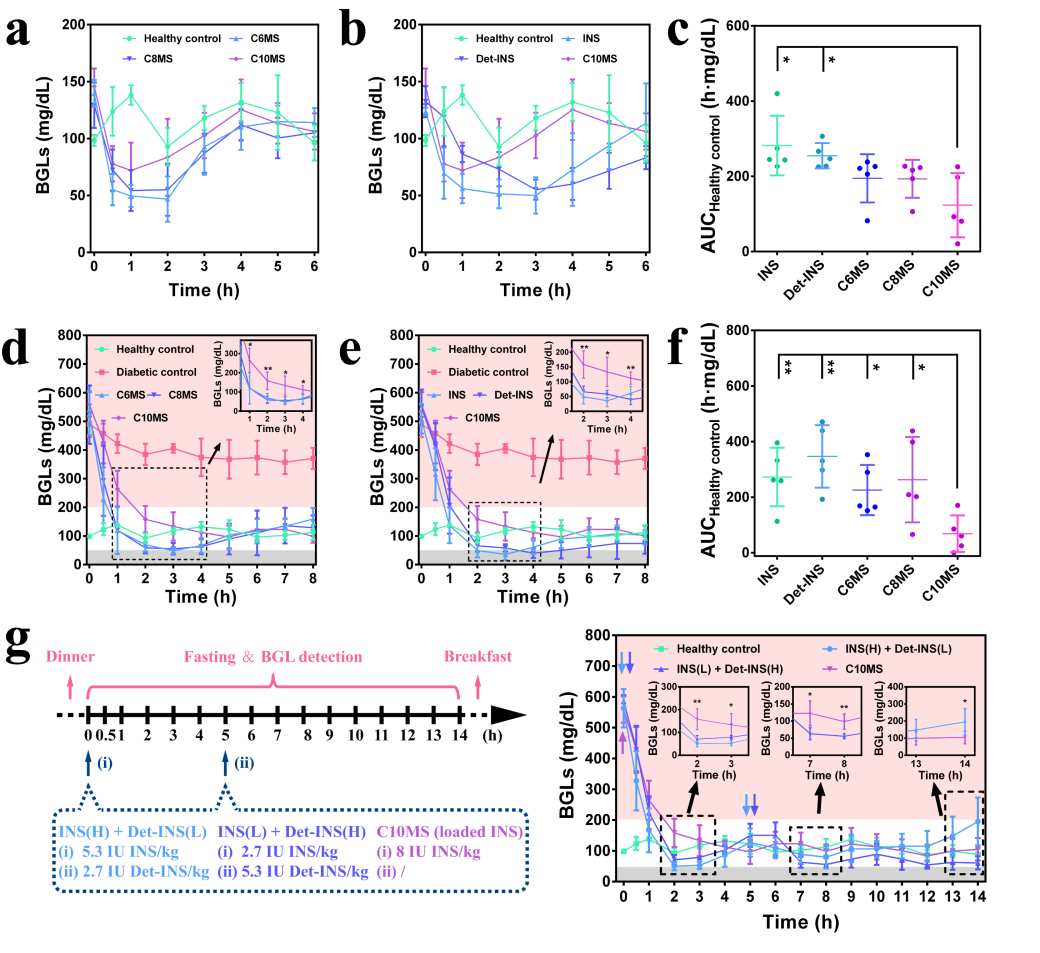
Figure 5. (a, b) The hypoglycemia-avoiding performances of the anti-diabetes agents evaluated on healthy rats with (c) the statistical analysis. (d, e) The 8-h hyperglycemia-ameliorating and hypoglycemia-avoiding performances of the anti-diabetes agents evaluated on diabetic rats with (f) the statistical analysis. (g) The 14-h hyperglycemia-ameliorating and hypoglycemia-avoiding performances. The data of ��Diabetic control�� were shown as the means �� SD (n = 3). The data of ��Healthy control��, ��C6MS��, ��C8MS��, ��C10MS��, ��INS��, ��Det-INS��, ��INS(H) + Det-INS(L)�� and ��INS(L) + Det-INS(H)�� were shown as the means �� SD (n = 5). The statistical analyses were performed by two-tailed Student''s t-test. * P < 0.05 and ** P < 0.01.
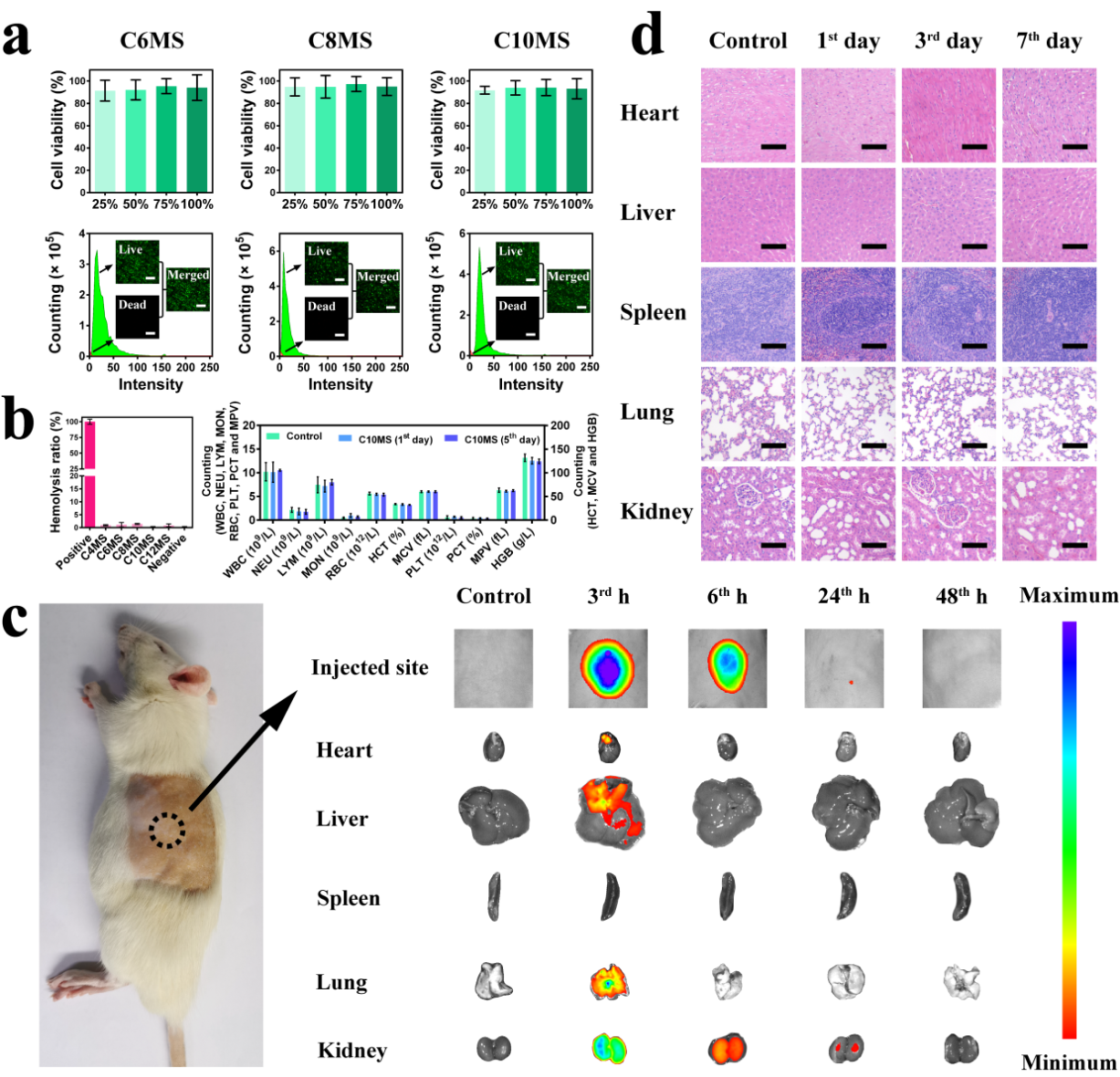
Figure 6. (a) The MTT assays and live-dead cell staining assays for CnMSs (n = 6, 8 and 10, scale bar = 200 ��m). (b) The hemolysis tests for CnMS (n = 4, 6, 8, 10 and 12) and the routine blood test for C10MS. (c) The in vivo fluorescence test on diabetic rats by using Cy5-labeled C10MS. (d) Histological analyses of C10MS on hearts, livers, spleens, lungs, and kidneys (scale bar = 100 ��m). The data of MTT assays were shown as the means �� SD (n = 6). The data of hemolysis tests were shown as the means �� SD (n = 3). The data of the routine blood test were shown as the means �� SD (n = 4).
Փ��朽ӣ�https://doi.org/10.1016/j.jconrel.2022.10.044
- �㽭��W��V������n�}�M Macromolecules�����I�Ӧ�-�����_�h�ۺ��Ƃ���u��֬���� 2025-03-03
- ���A��Wꐇ������ڡ��ǭ������� Adv. Sci.: �Ծ��u��֬����������̽�������w�e��С�����I���a��Ӱ� 2025-02-22
- ��ƴ��R��܊/��ȵ� Biotechnol. Adv. �C����ľ�|�w�S�������|���a���u��֬���������Mչ��չ�� 2025-01-02
- ���ִ�W�X��܊���ڈF� PRL����朼{������ͻ�Ƹ߷��Ӳ��ϡ�����-�g��-�ӹ��ԡ����y���� 2025-10-15
- �㽭��W�������ڡ�����ܽ��ڈF� JCIS�����ڰ�ȫ�Ź������ʹ̼�푑�ˎ���f�͵ļ{������ 2025-09-09
- �A�����γ�/�V�����Ҹ��F� Nano Lett.��ܛ�{�����Ӷ��r�Մ����W���� 2025-08-21
- �㽭��W�������ڡ�����ܽ��ڈF� Carbohyd. Polym.����������ˮ���z�������LЧ�ȍu���f����N 2024-11-21